iHealth - Clinical Intelligence
iHealth · Clinical Dashboards

Real-time clinical intelligence. With the data your hospital already produces.

Hospital managers make critical decisions every day — about care quality, patient safety, operational efficiency, and financial performance. But most of these decisions are based on delayed reports, incomplete indicators, or data that never left the free text of the medical record.

iHealth structures the clinical data that already exists in your systems and delivers a BI platform customized for each decision-maker — with real-time indicators, strategic dashboards, and drill-down to the individual patient level.

The challenge

Having an electronic health record is not the same as having clinical intelligence.

Most Brazilian hospitals already have an electronic health record. But when a manager needs to know the 30-day readmission rate for cardiac patients, or identify which units have the highest incidence of adverse events, or understand the real epidemiological profile of the population served — the answer is rarely available.

The problem is not a lack of data. It is a lack of structured data. Between 70% and 80% of the most relevant clinical information is in free text — progress notes, clinical notes, reports — inaccessible to any conventional BI system.

iHealth reads that text, extracts clinical variables using NLP, and delivers them in interpretable dashboards, customized for each decision-making level of the institution.

Ver as soluções
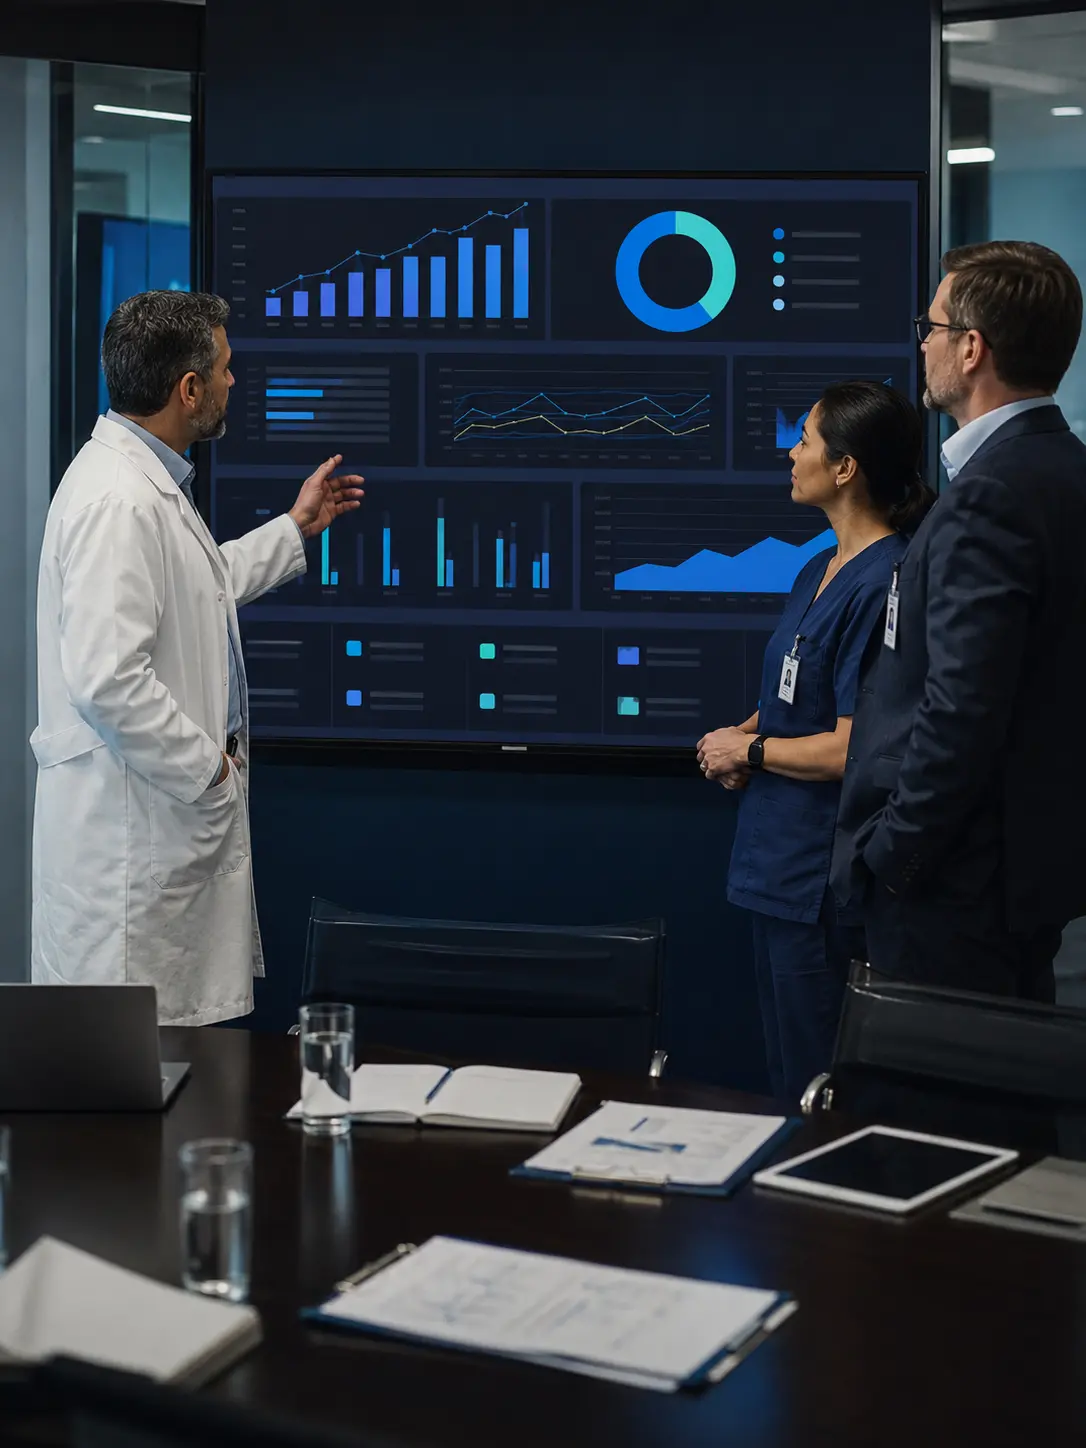
iHealth hospital clinical dashboards with real-time indicators
Solutions

What iHealth delivers in Clinical Dashboards

Care Performance Dashboard

Real-time clinical indicators for hospital managers and quality teams: 30-day readmission rate by diagnosis, average length of stay, occupancy rate by specialty, clinical outcomes by treatment line, and performance comparison across units. Drill-down to the individual patient level, with full traceability to the source data.

Real-time clinical indicators for hospital managers and quality teams: 30-day readmission rate by diagnosis, average length of stay, occupancy rate by specialty, clinical outcomes by treatment line, and performance comparison across units. Drill-down to the individual patient level, with full traceability to the source data.

Patient Safety Dashboard

Continuous monitoring of adverse events, near misses, and safety indicators automatically extracted from clinical text — in real time. Early identification of risk patterns before they become incidents. Supports hospital accreditation (JCI, ONA) with traceable, auditable clinical evidence, exportable for quality reports.

Continuous monitoring of adverse events, near misses, and safety indicators automatically extracted from clinical text — in real time. Early identification of risk patterns before they become incidents. Supports hospital accreditation (JCI, ONA) with traceable, auditable clinical evidence, exportable for quality reports.

Financial and Billing Dashboard

Visibility into care-related financial performance: average cost per admission and per treatment line, denial analysis by cause, financial impact of preventable readmissions, and revenue-versus-coded-complexity comparison. Integrated with the AI-powered DRG & Auditing module to close the loop between clinical data and financial outcomes.

Visibility into care-related financial performance: average cost per admission and per treatment line, denial analysis by cause, financial impact of preventable readmissions, and revenue-versus-coded-complexity comparison. Integrated with the AI-powered DRG & Auditing module to close the loop between clinical data and financial outcomes.

Population Epidemiological Dashboard

Clinical and demographic profile of the population served by the institution — by primary diagnosis, comorbidities, age group, geographic origin, and service utilization pattern. Identification of high-risk subpopulations, chronic-care management opportunities, and support for strategic planning based on the institution's own real data.

Clinical and demographic profile of the population served by the institution — by primary diagnosis, comorbidities, age group, geographic origin, and service utilization pattern. Identification of high-risk subpopulations, chronic-care management opportunities, and support for strategic planning based on the institution's own real data.

Institutional Clinical Research Dashboard

For hospitals with research programs, a dedicated dashboard for tracking ongoing studies: confirmed eligibility rate, recruitment progress by protocol, criteria deviations, and adverse event alerts. Full visibility into the research portfolio with real-time data integrated from the medical record.

For hospitals with research programs, a dedicated dashboard for tracking ongoing studies: confirmed eligibility rate, recruitment progress by protocol, criteria deviations, and adverse event alerts. Full visibility into the research portfolio with real-time data integrated from the medical record.

Customized Executive Reports

Periodic reports customized for the institution's leadership and board — translating clinical indicators into strategic business language. Benchmarking against the iHealth network base, trend analysis, and projections based on real historical data. Delivered in the format and frequency the institution's governance requires.

Periodic reports customized for the institution's leadership and board — translating clinical indicators into strategic business language. Benchmarking against the iHealth network base, trend analysis, and projections based on real historical data. Delivered in the format and frequency the institution's governance requires.

Why iHealth

What sets us apart from any other data source in Brazil

Proprietary data — not third-party

iHealth owns its data infrastructure. We do not broker data from other sources — we generate, structure, and maintain our own longitudinal clinical database, with full control over quality, traceability, and regulatory compliance.

iHealth owns its data infrastructure. We do not broker data from other sources — we generate, structure, and maintain our own longitudinal clinical database, with full control over quality, traceability, and regulatory compliance.

NLP trained for Brazilian medical Portuguese

Our NLP engine is not a generic tool adapted to Portuguese. It was built from scratch for the vocabulary, abbreviations, and narrative structures of Brazilian medical Portuguese — with clinical accuracy validated by specialists.

Our NLP engine is not a generic tool adapted to Portuguese. It was built from scratch for the vocabulary, abbreviations, and narrative structures of Brazilian medical Portuguese — with clinical accuracy validated by specialists.

Real multi-regional coverage

40+ hospitals across all 5 regions of Brazil — not just São Paulo and Rio. This means genuine epidemiological representativeness of the Brazilian population, with geographic, demographic, and treatment-pattern diversity.

40+ hospitals across all 5 regions of Brazil — not just São Paulo and Rio. This means genuine epidemiological representativeness of the Brazilian population, with geographic, demographic, and treatment-pattern diversity.

Governance and regulatory compliance

LGPD-first architecture with anonymization at the source, irreversible hashing, full lineage, and documented legal bases. Outputs ready for regulatory submission to CONITEC, ANVISA, FDA, and EMA.

LGPD-first architecture with anonymization at the source, irreversible hashing, full lineage, and documented legal bases. Outputs ready for regulatory submission to CONITEC, ANVISA, FDA, and EMA.

Part of Brazil's largest clinical alliance

Your next project needs real clinical data from Brazil.

We have the database. We have the methodology. And we have the hospital partners to support your project — from design to results.

WhatsApp